In this tutorial, we are going to show you how to install Graylog on Debian 7 , in a step by step process. In addition, we will configure the Graylog agent on Windows (NXLog) along with Graylog Streams and Graylog Dashboards.
What is Graylog
Graylog is a java based open source log management platform that can collect log messages from multiple sources such as devices, operating systems, and applications which forward its data to inputs such as syslog and GELF for the logs to be analyzed.
Main Components
Graylog is made up of four main components:
- Elasticsearch
- MongoDB
- Graylog Server
- Graylog Web
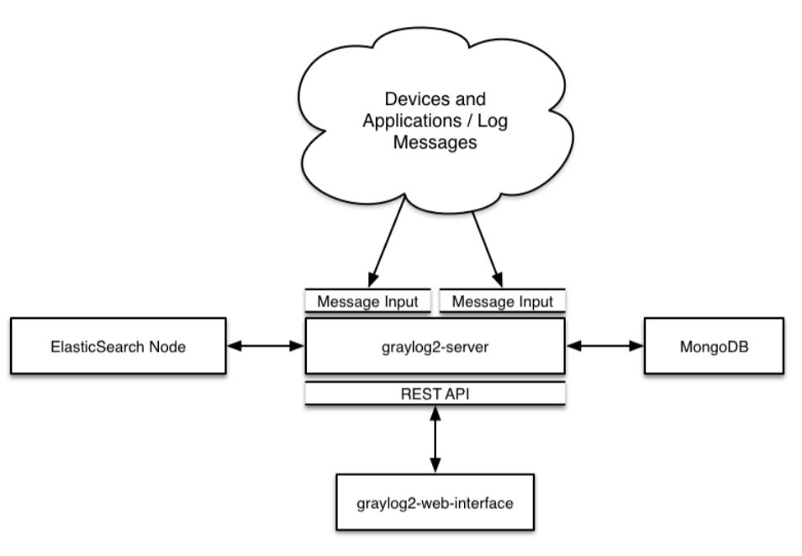
Elasticsearch: Graylog uses Elasticsearch to store all logs and messages. It is also used as a full text search engine. If there is a data loss on Elasticsearch, the messages will be deleted.
MongoDB: Graylog uses mongodb for the web interface entities, streams, alerts, users, settings, cached stream counts and metadata.
Graylog Server: Receives and processes messages, and communicates with all other non-server components.
Graylog Web: Acts as the user interface, waiting for HTTP answers of the rest of the system
Hardware Requirements
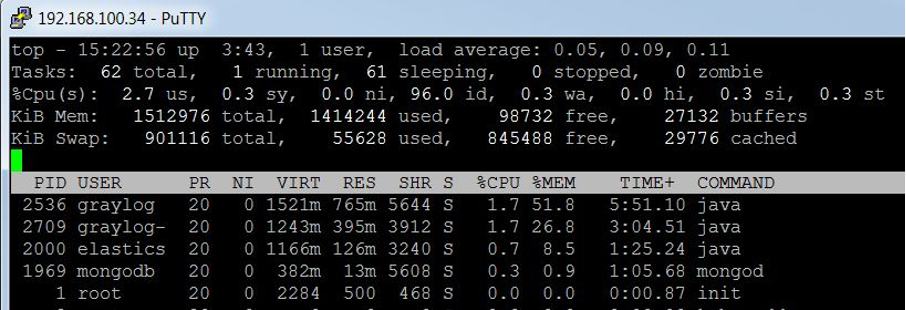
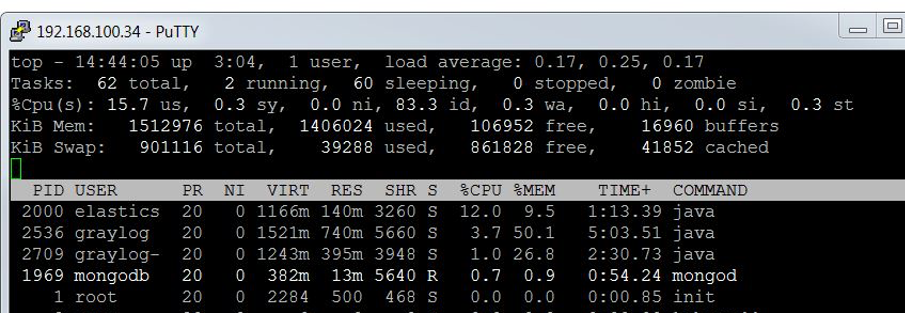
Referring to the Graylog official documentation, only two components will use most of the system resources; Elasticsearch needs RAM and fast disks to function properly, and Graylog-Server needs CPU to process logs.
Tests have been made to reveal the actual resources that are used by Graylog. The machine used for testing has the following specifications:
- CPU: 3.4 GHz (1 Core)
- RAM: 1500 MB
- HDD: 20 GB
Graylog while processing 0 messages (Standby):
Graylog while processing 30 messages per second:
For small setups, a minimum of 4 GB of RAM is enough. In addition, memory heap allocated for Elasticsearch must be increased from 1 GB to 2 GB
When it comes to larger setups, deploying each of Graylog components on a different server is recommended, in addition to at least 8 GB of RAM for the Elasticsearch alone.
Retention
In order to read Windows Events logs properly, Graylog uses the GELF format. The Graylog Extended Log Format (GELF) is a log format is limited to length of 1024 bytes. This means that each log/message is 1Kb in size.
Default configuration shows that Graylog will retain a total of 20 indices, with each index holding close to 20,000,000 events. Each event is at least 1Kb in size, so an index would reach a size of 20 GB.
Installing Prerequisites
Java 8
We need to add the WebUpd8 Oracle Java PPA repository to the Software Sources in Debian.
echo "deb http://ppa.launchpad.net/webupd8team/java/ubuntu trusty main" | tee /etc/apt/sources.list.d/webupd8team-java.listDownload and install the Public Signing Key:
apt-key adv --keyserver hkp://keyserver.ubuntu.com:80 --recv-keys EEA14886Update the sources list:
apt-get updateInstall the Java repository:
apt-get install oracle-java8-installerYou will be asked to accept the license agreement. Once you finish installation, issue the below command to confirm that Java installed successfully:
java –versionMongoDB 3.0.4
Import the public key used by the package management system.
apt-key adv --keyserver keyserver.ubuntu.com --recv 7F0CEB10Create the source list file for MongoDB.
echo "deb http://repo.mongodb.org/apt/debian wheezy/mongodb-org/3.0 main" | tee /etc/apt/sources.list.d/mongodb-org-3.0.listReload local package database
apt-get updateInstall MongoDB
apt-get install -y mongodbElasticsearch 1.6
Download and install the Public Signing Key:
wget -qO - https://packages.elastic.co/GPG-KEY-elasticsearch | apt-key add -Add the repository definition to your /etc/apt/sources.list file:
echo "deb http://packages.elastic.co/elasticsearch/1.6/debian stable main" | tee -a /etc/apt/sources.listRun apt-get update and the repository is ready for use. You can install it with:
apt-get update

apt-get install elasticsearch
Configure Elasticsearch to automatically start during bootup
update-rc.d elasticsearch defaults 95 10To avoid problems when trying to start the elasticsearch service after server reboot, change the PID_DIR attribute:
cd /etc/init.dChange the value of PID_DIR attribute from
/var/run/elasticsearchto:
/var/runSave the file and restart elasticsearch service:
service elasticsearch restartInstalling Graylog
Download the graylog repository package:
cd /tmpwget https://packages.graylog2.org/repo/packages/graylog-1.1-repository-debian7_latest.debInstall the package using the below command:
dpkg -i graylog-1.1-repository-debian7_latest.debTo enable the usage of ‘deb https:// distro main’ lines in the /etc/apt/sources.list, install the below package:
apt-get install apt-transport-httpsInstall both Graylog compoenents; Server and Web:
apt-get update

apt-get install graylog-server graylog-web
Configuration
Configuring Elasticsearch
Now that we install Graylog on Debian, open the configuration file of Elasticsearch:
nano /etc/elasticsearch/elasticsearch.ymlFind the section that specifies cluster.name. Uncomment it, and replace the default value with “graylog2”:
cluster.name: graylog2Restrict outside access to the Elasticsearch instance (port 9200). Uncomment the below:
network.bind_host: 192.168.100.34Disable dynamic scripts to avoid remote execution by adding the following line at the end of the file:
script.disable_dynamic: trueStart the elasticsearch service and confirm it is running:
service elasticsearch restart

service elasticsearch status
Configuring Graylog Server
Install pwgen, which we will use to generate password secret keys. We will use the passwords generated to configure the graylog server.
apt-get install pwgenGenerate a new password secret key:
pwgen -s 96 1Generate a new hash key using the below command. Note that “yourpassword” will be the password used to login to the Graylog Web interface.
echo -n yourpassword | shasum -a 256Edit the Graylog Server configuration file:
nano /etc/graylog/server/server.confAdd the password secret key you generated next to the following line:
password_secret = YOUR-SECRET-KEY-HEREAdd the hash key you generated next to the following line:
root_password_sha2 =Change the below lines to allow Graylog Web Interface to communicate with the server:
rest_listen_uri = http://192.168.100.34:12900/

rest_transport_uri = http://192.168.100.34:12900/
Because we only have one Elasticsearch shard, we will change the value of elasticsearch_shards to 1:
elasticsearch_shards = 1Save and quit the configuration file. Start the graylog-server service:
service graylog-server startConfiguring Graylog Web
Edit the Graylog Server configuration file:
nano /etc/graylog/web/web.confThe below line lists the graylog server nodes the web interface will try to use. You can configure one or multiple, separated by commas:
graylog2-server.uris=http://192.168.100.34:12900/Generate a secret key
pwgen -N 1 -s 96Add the secret key to the line below for encryption:
application.secret = ""Start the graylog-web service:
service graylog-web startOnce the configuration is complete, you will be able to login to the Graylog web interface using the port 9000.
http://192.168.100.34:9000Graylog Agent on Windows
Introduction to Nxlog
Today’s IT infrastructure can be very demanding in terms of event logs. Hundreds of different devices, applications, appliances produce vast amounts of event log messages. These must be handled in real time, forwarded or stored in a central location after filtering, message classification, correlation and other typical log processing tasks.
In most organizations these tasks are solved by connecting a dozen different scripts and programs which all have their custom format and configuration. The nxlog community edition is an open source, high-performance, multi-platform log management solution aimed at solving these tasks and doing it all in one place.
In concept nxlog is similar to syslog-ng or rsyslog but it is not limited to unix and syslog only. It supports different platforms, log sources and formats so nxlog can be an ideal choice to implement a centralized logging system.
It can collect logs from files in various formats; receive logs from the network remotely over UDP, TCP or TLS/SSL on all supported platforms. It supports platform specific sources such as the Windows Eventlog, Linux kernel logs, Android device logs, local syslog etc.
Writing and reading logs to/from databases is also supported for many database servers. The collected logs can be stored into files, databases or forwarded to a remote log server using various protocols.
A key concept in nxlog is to be able to handle and preserve structured logs so there is no need to convert everything to syslog and then parse these logs again at the other side. It has powerful message filtering, log rewrite and conversion capabilities. Using a lightweight, modular and multithreaded architecture which can scale, nxlog can process hundreds of thousands of events per second.
Why Nxlog
After we install Graylog on Debian, we need a way of Implementing a centralized logging system has a critical role in IT security. Logs from all critical infrastructure elements need to be collected and forwarded securely and reliably to a central log server. This means that many different types of log sources, formats and platforms need to be handled.
In the open source world the most common way to tackle this problem is to use syslog-ng or rsyslog for the central log collector. These can handle syslog natively, so basically this covers all sources which can send in syslog format (unix/linux, most network devices and appliances). I
n order to collect from Windows based systems, a special log collector tool needs to be installed which can read EventLog then convert it to syslog and forward it over the network to the central log server. Apart from closed source and proprietary solutions, the most popular open source tools for this task are Snare Agent and Eventlog-to-syslog. While this setup can get the job done, there are a couple problems with this approach which nxlog does not suffer from.
Different agent or log collector for each platform and log source
You need to deploy and manage different tools on each platform just to be able to collect logs. Their configuration method, syntax and configuration parameters are different for each. There is no uniform way to install, configure, run and manage these tools. While this problem is not significant while they can get the job done, this can still cause quite a lot of problems down the road.
No security and reliability
These EventLog forwarder tools utilize the old syslog protocol where UDP is used as the network transport. Because UDP is an unreliable protocol, messages can be lost even under normal circumstances. Some support TCP to solve the unreliable nature of UDP, but this does not guarantee secure transmission. TLS/SSL is hardly available among these tools which would enable forwarding the logs over the network securely and reliably. Another big problem is the lack of proper flow control and buffering. Even if TCP is used which ensures that messages will not be lost over the network, without proper flow control and buffering there is a chance that these tools will loose and drop log messages locally.
Discarding meta-data and structure
We think that converting Windows EventLog to syslog is a fundamentally flawed idea and is a hack around an incompatibility problem which should be solved the right way. Though the newer syslog standard (as defined in RFC 5424) would partly solve this issue by allowing to send structured meta-data along with the message, these EventLog forwarders only support the old syslog protocol (RFC 3164) which even lacks a proper date format as there is no year in the date.
Windows EventLog allows multi-line messages, so this text is a lot more readable and nicely formatted by spaces, tabs and line-breaks as can be seen in Event Viewer. Because syslog is a single-line message, this formatting must be stripped from the EventLog message. The most common is the format used by the Snare Agent and has become widespread in other tools also. This stores the EventID, User name, Domain and other fields in the message part of the syslog line in a TAB delimited format. Then the central logserver must be instructed to parse the log in order to store the fields in a database.
When additional meta-data is required (such as IP addresses, port numbers, email addresses etc.) special patterns need to be created which can extract these fields from the log message.
The newer EventLog format can store structured meta-data along with the message. When you look at logs in Event Viewer you can see such fields as in the following example:
<EventData>
  <Data Name="SubjectUserSid">S-1-5-18</Data>
  <Data Name="SubjectUserName">WIN-OUNNPISDHIG$</Data>
  <Data Name="SubjectDomainName">WORKGROUP</Data>
  <Data Name="SubjectLogonId">0x3e7</Data>
  <Data Name="TargetUserSid">S-1-5-18</Data>
  <Data Name="TargetUserName">SYSTEM</Data>
  <Data Name="TargetDomainName">NT AUTHORITY</Data>
  <Data Name="TargetLogonId">0x3e7</Data>
  <Data Name="LogonType">5</Data>
  <Data Name="LogonProcessName">Advapi</Data>
  <Data Name="AuthenticationPackageName">Negotiate</Data>
  <Data Name="WorkstationName" />
  <Data Name="LogonGuid">{00000000-0000-0000-0000-000000000000}</Data>
  <Data Name="KeyLength">0</Data>
  <Data Name="ProcessId">0x1dc</Data>
  <Data Name="ProcessName">C:\Windows\System32\services.exe</Data>
  <Data Name="IpAddress">-</Data>
  <Data Name="IpPort">-</Data>
</EventData>
Why would you want to write patterns and parser rules to extract this data from the message when it is already available at the source in a structured format? We think that converting to syslog is a flawed idea because it discards valuable meta-data. nxlog is capable of reading these fields and can forward these remotely, or act upon (i.e. alert, correlate), thus sparing you time and resources. There is no need to waste time writing patterns to extract usernames, IP addresses and similar meta-data.
NXLog Features
- Open source: The NXLog Community Edition source code and binary packages are available under the NXLog Public License. Anyone is free to use and modify it under the terms of the license.
- Multi-platform: Supports many different operating systems such as Linux (Debian, Redhat, Ubuntu), BSD, HP-UX, IBM AIX, Solaris, Android and also Microsoft Windows (no, it does not require cygwin) so you don’t need a different collector/agent for that other platform.
- Modular architecture: Dynamically loadable modules (=plugins) are available to provide different features and functionality similarly as the Apache HTTP server does it. It will only load modules which are needed by the log processing configuration. Log format parsers, transmission protocol handlers, database modules and nxlog language extensions are such modules. A module is only loaded if it is necessary resulting in a small memory footprint. Modules have a common API, developers can easily write new modules and extend the functionality of nxlog.
- Support for different message formats: The nxlog community edition supports many different log formats such as Syslog (both BSD and IETF syslog as defined by RFC 3164 and RFC 5424), CSV, JSON, XML, GELF, Windows EventLog, etc. It’s easy to create a parser rule for custom application logs or a write module to handle binary formats. nxlog is not only syslog daemon but can fully function as one. Log messages need not to be flattened out and squeezed into the syslog format or similar single line messages if this is not required. A special nxlog message format can preserve the parsed fields of log messages and transfer these across the network or store in files. This alleviates the need to parse the messages again at the receiver side and avoids loosing any information which was available at the source.
- Client-server mode: nxlog can act both as a client and/or a server. It can collect logs from local files and the operating system then forward it to to a remote server. It can accept connections and receive logs over the network then write these to a database or files or forward it further. It all depends how it is configured.
- Log message sources and destinations: In addition to reading from and writing to log files, nxlog supports different protocols on the network and transport layer such as TCP, UDP, TLS/SSL and Unix Domain Socket. It can both read and write from such sources and can convert between then, read input from an UDP socket and send out over TCP for example. Many database servers are supported (PostgreSQL, MySQL, Oracle, MsSQL, SqlLite, Sybase, etc) so that log messages or data extracted from log messages can be stored in or read from a database.
- Secure operations, secured messages: On unix systems nxlog can be run as a normal user by dropping its root privileges even if some sources require special privileges. To secure data and event logs, nxlog provides a TLS/SSL transport so that messages cannot be intercepted and/or altered during transmission.
- Lightwight: Written in good old C, nxlog is blazingly fast while consuming only a fraction of the resources. On average it only requires a few megabytes of memory and can be an ideal choice for embedded systems as well. It does not depend on any runtime environment such as Java, .NET, Ruby or Python and you will notice that it is quite slim compared to other log collector tools written in higher level languages.
- Scalable, multi-threaed and high-performance architecture: Reading input, writing output and log processing (parsing, pattern matching, etc) are all handled in parallel. For example when single threaded syslog daemons block trying to write output to a file or database, UDP input can be be lost. The multi-threaded architecture of nxlog not only avoids this problem but enables to fully utilize today’s multi-core and multi-processor systems for maximum throughput. The massively multi-threaded architecture of nxlog enables it to process log messages from thousands of simultaneous network connections above a hundred thousand event per second (EPS) rate.
- Message buffering and prioritization: Log messages can be buffered in memory or on disk in order to avoid losing messages. Together with the nxlog language it is also possible to do conditional buffering based on different parameters (time or system load for example). Not all log sources are always equally important. Some systems send critical logs which should be processed at a higher priority than others. nxlog supports assigning priorities to log routes, this ensures that higher priority log messages are dealt with (read, processed and written/sent out) first, only then are the messages with lower priorities handled.
- No message loss: nxlog will not drop log messages, it will throttle back on the input side wherever possible. Though nxlog can be explicitly instructed to drop log messages depending on certain conditions in order to avoid a possible resource exhaustion. UDP syslog is a typical case where a message can be lost due to the nature of the UDP protocol. If the kernel buffer becomes full because it is not read, the operating system will drop any further received UDP messages. If a log processing system is busy processing logs, reading from TCP and UDP and writing to database or disk, the kernel UDP buffer can fill quickly. Utilizing the above mentioned parallel processing, buffering and I/O prioritization features it is possible to greatly reduce losing UDP syslog messages. Of course using TCP can help avoiding message loss, unfortunately there are many archaic devices which only support UDP syslog.
- Simple configuration: nxlog uses Apache style configuration file syntax. This format is in use by many other popular system daemons and tools as it is easy to read and/or generate by both humans and scripts.
- Built-in config language: A built-in configuration language enables administrators to create correlation rules, parse, format or rewrite messages, execute some action or convert to another message format. Using this language it is possible to do virtually anything without the need to forward messages to an external script. This built-in nxlog language is very similar in syntax to Perl, which is highly popular in the log processing world. In addition to the normal operations it supports polymorphic functions and procedures, and regular expressions with captured substrings. It should be fairly trivial to write and understand, unlike some macro based configuration languages found in other solutions.
- Scheduled tasks and built-in log rotation: nxlog has a built-in scheduler similar to cron, but with more advanced capabilities to specify the timings. Using this feature, administrators can automate tasks such as log rotation or system statistics within nxlog without having to use an external scheduler. Log files can be rotated by size, time and various conditions, there is no need for external log rotation tools. Log rotation can also be scheduled in order to guarantee timely file rotation. The file input reader module supports external log-rotation scripts, it can detect when an input file was moved/renamed and will reopen its input. Similarly, the file output writer module can also monitor when the file being written to is rotated and will reopen its original output. This way it is possible to keep using external log rotation tools without the need to migrate to the built-in log rotation.
- Event classification and pattern matching: In addition to the features provided by the above mentioned built-in nxlog language, using additional modules nxlog is capable to solve all tasks related to log message processing such as message classification, event correlation, pattern matching, message filtering, rewrite, conditional alerting etc.
- Offline processing mode for post processing, conversion or transfer: Sometimes messages need to be processed in an offline fashion, convert log files to another format, filter out messages or load files into a database for log analysis purposes. nxlog can also work in an offline mode when it processes log messages until there is no more input and then exits, thus it is possible to do batch processing tasks with it also.
- Internationalization support: nxlog supports explicit character set conversion from one character set to another. In addition it can also detect the character set of a string and convert it to a specific character set. Using charset autodetection, nxlog is capable of normalizing log messages which can contain strings in mixed character sets even without knowing the exact encoding of the source log message.
Installing, Configuring, and Starting NXLog
Before you continue, you need to make sure you install Graylog on Debian.
Download the latest windows MSI package from:
http://nxlog.org/products/nxlog-community-edition/download
- Run the nxlog installer using the MSI package, accept the license agreement and click finish.
- Edit nxlog.conf; the nxlog configuration file
nxlog.confis put underC:\Program Files\nxlog\conforC:\Program Files (x86)\nxlog\confon 64bit architectures.
- Using a text editor such as notepad.exe, open
nxlog.conf.
- Verify the ROOT path in nxlog.conf
The windows installer uses the C:\Program Files\nxlog directory for the installation. On 64bit machines this is C:\Program Files (x86)\nxlog. We refer to this as the ROOT path. Please verify the nxlog.conf configuration file and use the appropriate ROOT path:
define ROOT C:\Program Files\nxlogor
define ROOT C:\Program Files (x86)\nxlogIn our case, we will use the following configuration in order to send all the system “critical” and “error” events (which are referred to by system levels 1 and 2) to the server, and exclude others. Events are sent to the Graylog server whose ip is 192.168.100.34
define ROOT C:\Program Files (x86)\nxlog
Moduledir %ROOT%\modules
CacheDir %ROOT%\data
Pidfile %ROOT%\data\nxlog.pid
SpoolDir %ROOT%\data
LogFile %ROOT%\data\nxlog.log
<Extension gelf>
Module xm_gelf
</Extension>
<Input in>
# Use ’im_mseventlog’ for Windows XP, 2000 and 2003
Module im_msvistalog
# Uncomment the following to collect specific event logs only
Query <QueryList>\
<Query Id="0">\
<Select Path="System">*[System/Level=1]</Select>\
<Select Path="System">*[System/Level=2]</Select>\
<Suppress Path="System">*[System[(EventID=1111)]]</Suppress>\
<Suppress Path="System">*[System[(EventID=56)]]</Suppress>\
<Suppress Path="Security">*</Suppress>\
<Suppress Path="Application">*</Suppress>\
</Query>\
</QueryList>
</Input>
<Output out>
Module om_udp
Host 192.168.100.34
Port 12201
OutputType GELF
</Output>
<Route r>
Path in => out
</Route>
In order to prevent a certain EventID from being reaching Graylog, use the </Suppress> query:
<Suppress Path="System">*[System[(EventID=1111)]]</Suppress>\The above line will stop any logs with EventID 1111 from going to Graylog.
NXLog service can be started using the following methods:
- Start the Service Manager, find ‘nxlog’ in the list. Select it and start the service.
- Double-click on nxlog.exe.
Check the logs
The default configuration instructs nxlog to write its own logs to the file located at C:\Program Files\nxlog\data\nxlog.log or C:\Program Files (x86)\nxlog\data\nxlog.log. Open it with notepad.exe and check for errors. Note that some text editors (such as wordpad) need exclusive locking and will refuse to open the log file while nxlog is running.
Graylog Message Inputs
After you install Graylog on Debian, we need to configure message inputs. Message inputs are the Graylog parts responsible for accepting log messages. They are launched from the web interface (or the REST API) in the System -> Inputs section and are launched and configured without the need to restart any part of the system.
Adding a New Input
In order for Graylog to receive the messages and logs from the device, a new source should be added to the Graylog server using the web interface.
- Login to Graylog Web Interface using the below link (change according to the IP of the machine you are using):
http://192.168.100.34:9000
- Click on System/Inputs , and choose Inputs
- Choose GELF UDP and click on Launch new input
- A new popup will show. Choose a relevant Title for your input, and choose the Bind address to be the IP of the Graylog machine.
Graylog Streams
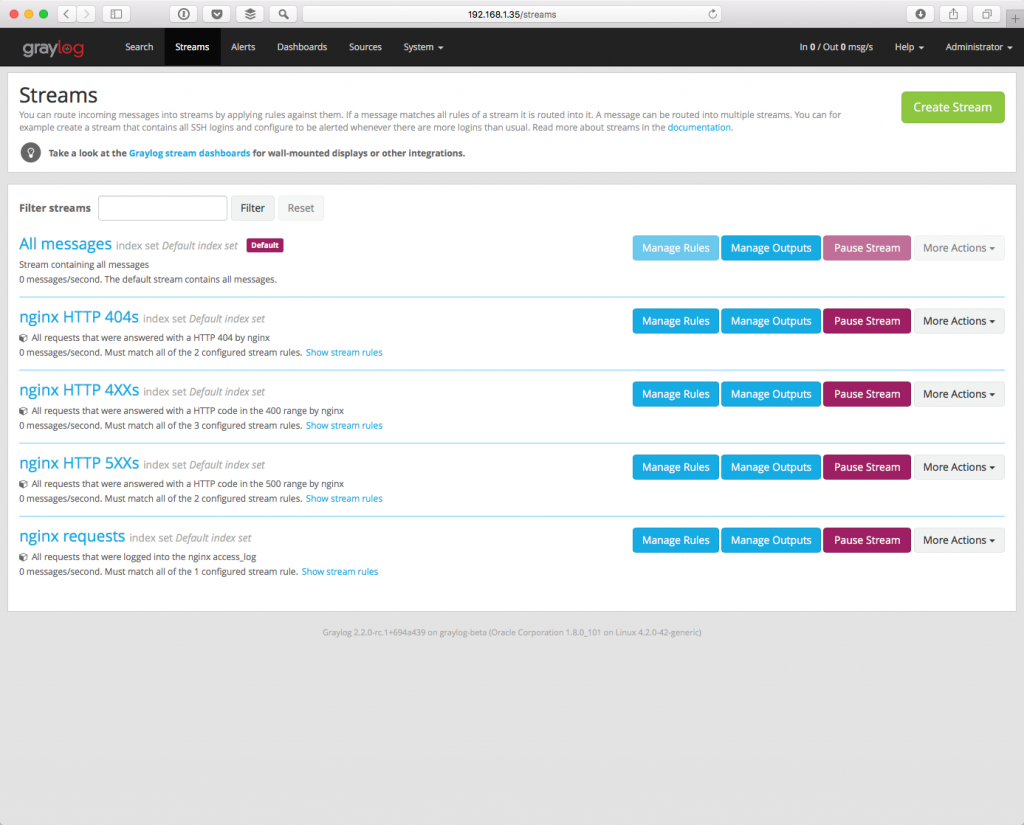
Streams are used as a way for categorizing the events. By using Streams feature in Graylog, you will be giving a Meta tag for the message logs, so they can be quickly searched for.
We will use the Streams to identify the message logs based on their source.
- Click on Streams, located on the upper navigation menu.
- Click on Create Stream
- Add a relevant Title and Description in the popup box, then click on Save
- Next to the new stream you added, click on Edit Rules
- Click on Add stream rule.
- Since we are going to filter streams based on the message source, in the Field textbox type: source.
In the Type drop box, choose “match regular expression”.
In the Value textbox type: SA-NOC.*
The “.* “ is used to inform the stream to choose all messages with source value starting with SA-NOC
In case we want to choose multiple sources to go into a certain stream, type in the Value textbox the following:
SA-FILE.*|SA-NOC.*
The “|” character acts as a logical OR.
Once finished from adding rules, click on I’m done, then Start the stream
Graylog Dashboards
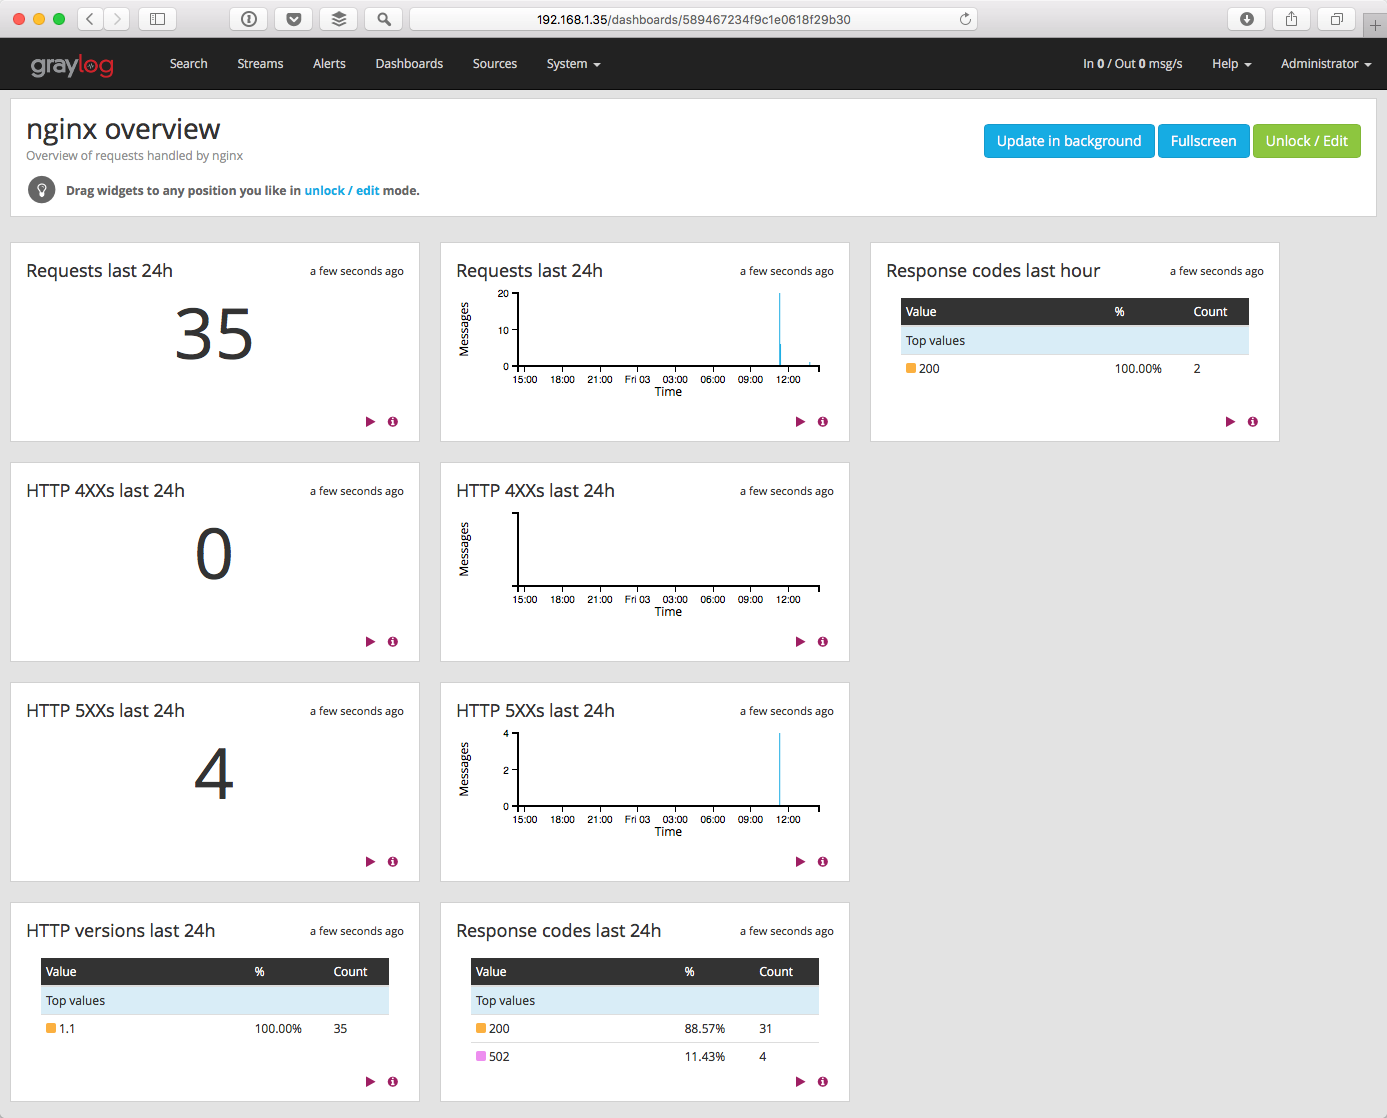
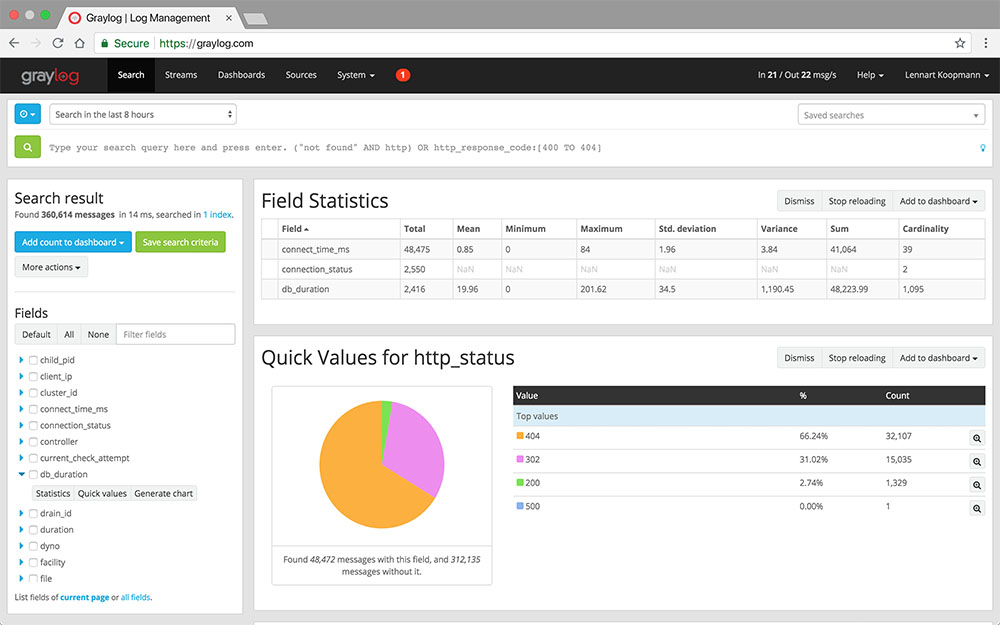
Dashboards act as an easy way to stay to show latest data and graphs. They can also be used to stay informed of any new message logs that arrive into Graylog. After you install Graylog on Debian, we need to configure dashboards so we can stay up to date.
We are going to add a widget showing the latest events coming to a certain stream during the last 8 hours.
- Click on Dashboards, located on the upper navigation menu.
- Click on Create dashboard, type a suitable Title and Description then click Create.
- Click on Streams and choose a certain stream.
- From the drop box located on the upper left part of the Graylog web interface, choose “Last 8 hours”.
- Click on the green “search” icon, then click on Add count to dashboard and choose your dashboard.
- Click on Dashboards, located on the upper navigation menu, and choose your dashboard.
- click on Unlock/Edit to edit the dashboard accordingly.
Now that you learned how to install Graylog on Debian 7, you can use this tool to monitor your WordPress server.

Leave a Reply